Spring Cloud API GW, LB, Logging, Monitoring
Topics to be covered
- Implementing API Gateway and Load Balancer
- The need for managing microservice communication and routing through an API gateway and distributing traffic using a load balancer.
- Setting Up Prometheus and Grafana with a Spring Project
- Monitoring system health and performance metrics, and visualizing them using Prometheus and Grafana.
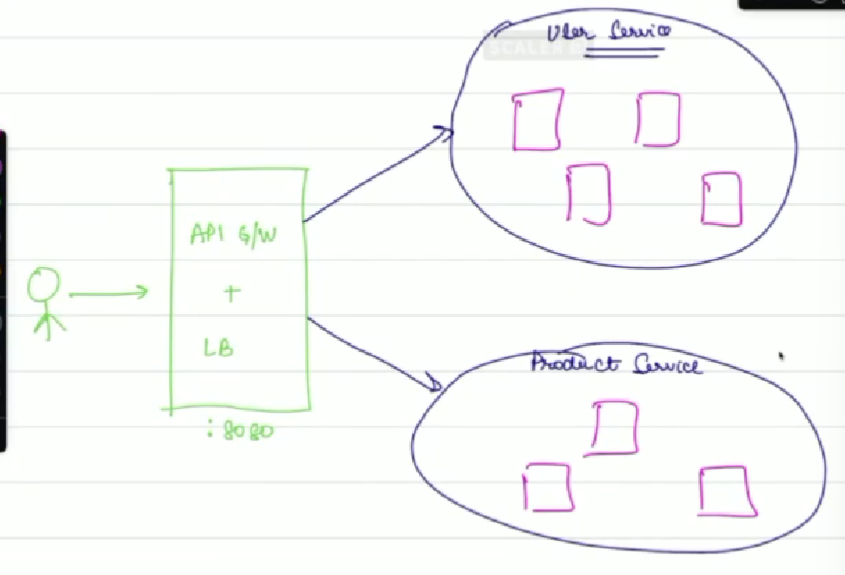
Implementing API Gateway and Load Balancer
-
API Gateway:
- Acts as the entry point for all client requests, forwarding them to the appropriate microservice. For instance, requests starting with
/productsare routed to the Product Service, while those starting with/usersgo to the User Service. - It also manages rate limiting, ensuring that no service is overwhelmed by too many requests.
- Acts as the entry point for all client requests, forwarding them to the appropriate microservice. For instance, requests starting with
-
Load Balancer:
- Distributes incoming traffic across multiple instances of the same service, such as multiple instances of the User Service or Product Service, ensuring optimal resource utilization and service availability.
Moving to a Unified Gateway and Load Balancer
- Instead of directly sending requests to specific ports (e.g., 5000 or 9000), we will now send requests to a unified server on port 80.
- This server will handle both load balancing and routing requests via the API Gateway.
- The API Gateway stays updated with the available services through service discovery, usually managed by Eureka.
Setting Up the API Gateway
Server Setup
- Use Maven and Java 17 for project setup.
- Choose the following Spring Cloud dependencies:
- Eureka Discovery Client for service discovery.
- Spring Cloud Gateway for routing.
- Spring Cloud Load Balancer for traffic distribution.
Configuring pom.xml
- Remove unwanted dependencies and manually add the necessary ones:
- Eureka Client for service discovery.
- Spring Cloud Starter Gateway for routing.
- Spring Cloud Starter Load Balancer for traffic management.
Configuring application.properties
- Application Name: Set your application name as
gateway:spring.application.name=gateway - Routing Requests: Define routes for the API Gateway. For instance, all
/productsrequests are directed to the Product Service:spring.cloud.gateway.routes[0].id=productservice spring.cloud.gateway.routes[0].predicates[0]=path=/products** spring.cloud.gateway.routes[0].uri=lb://productservice - Eureka Service Discovery: Enable communication with Eureka:
eureka.client.service-url.defaultZone=http://localhost:8761/eureka/
eureka.client.fetch-registry=true
eureka.client.register-with-eureka=true
Client-Side Load Balancing
- The API Gateway acts as a client-side load balancer, distributing requests across service instances.
- Consistent hashing is used for stateful services to route requests to the same server. For stateless services, consistent hashing is not needed.
Monitoring Systems with Spring Actuator
Spring Boot Actuator
- Actuator provides an easy way to monitor the health and metrics of your application through predefined endpoints.
- Access health metrics at:
localhost:8080/actuator/health - Expose all actuator endpoints by adding the following configuration:
management.endpoint.web.exposure.includes=*
Key Metrics Provided by Actuator
- Free and used disk space.
- Total memory and memory usage.
- CPU utilization.
- These metrics are vital for understanding the performance and capacity of your services.
Setting Up Prometheus and Grafana for Monitoring
Prometheus Overview
- Prometheus is an open-source monitoring and alerting toolkit designed to collect metrics from applications and provide insights into their performance.
- Pull Model: Prometheus pulls data from application endpoints every few seconds, such as from
/actuator/prometheus.
Prometheus Setup
-
Install Prometheus:
- Visit prometheus.io and follow the setup instructions.
- Ensure Docker is installed and configured.
-
Configure
prometheus.yml:- Define the target service for Prometheus to monitor, typically at the
/actuator/prometheusendpoint:scrape_configs: - job_name: 'productservice' metrics_path: '/actuator/prometheus' scrape_interval: 1s static_configs: - targets: ['localhost:8080']
- Define the target service for Prometheus to monitor, typically at the
-
Run Prometheus:
- Execute the Prometheus Docker container:
docker run -p 9090:9090 -v /path/to/prometheus.yml:/etc/prometheus/prometheus.yml prom/prometheus - Access the Prometheus dashboard at
localhost:9090.
- Execute the Prometheus Docker container:
Setting Alerts in Prometheus
- Prometheus allows setting up alert rules. When specific thresholds are reached, alerts are triggered (e.g., CPU usage above 80%).
Grafana Overview
- Grafana is a popular visualization tool that works with Prometheus to display collected metrics in a user-friendly manner.
- It is ideal for building dashboards that allow for real-time monitoring and alert management.
Installing Grafana
-
Download and Install Grafana:
- Visit grafana.com and download the appropriate version for your system.
- Once installed, access Grafana at
localhost:3000(default credentials: username/password:admin).
-
Configure Grafana Data Source:
- Add Prometheus as a data source by connecting it to
http://localhost:9090. - Create dashboards and visualize metrics such as CPU usage, memory, etc.
- Add Prometheus as a data source by connecting it to
Combining Prometheus and Grafana
- Prometheus pulls the data, while Grafana is used to visualize it.
- Alerts can be managed in Grafana, making it easier to monitor real-time issues.
Conclusion
By setting up an API Gateway with a load balancer, along with Prometheus and Grafana for monitoring, we achieve a robust architecture that: - Simplifies microservice routing. - Efficiently distributes traffic across service instances. - Provides real-time monitoring, visualization, and alerting to ensure system reliability and performance.
